|
Quantum VS Help: File Maintenance |
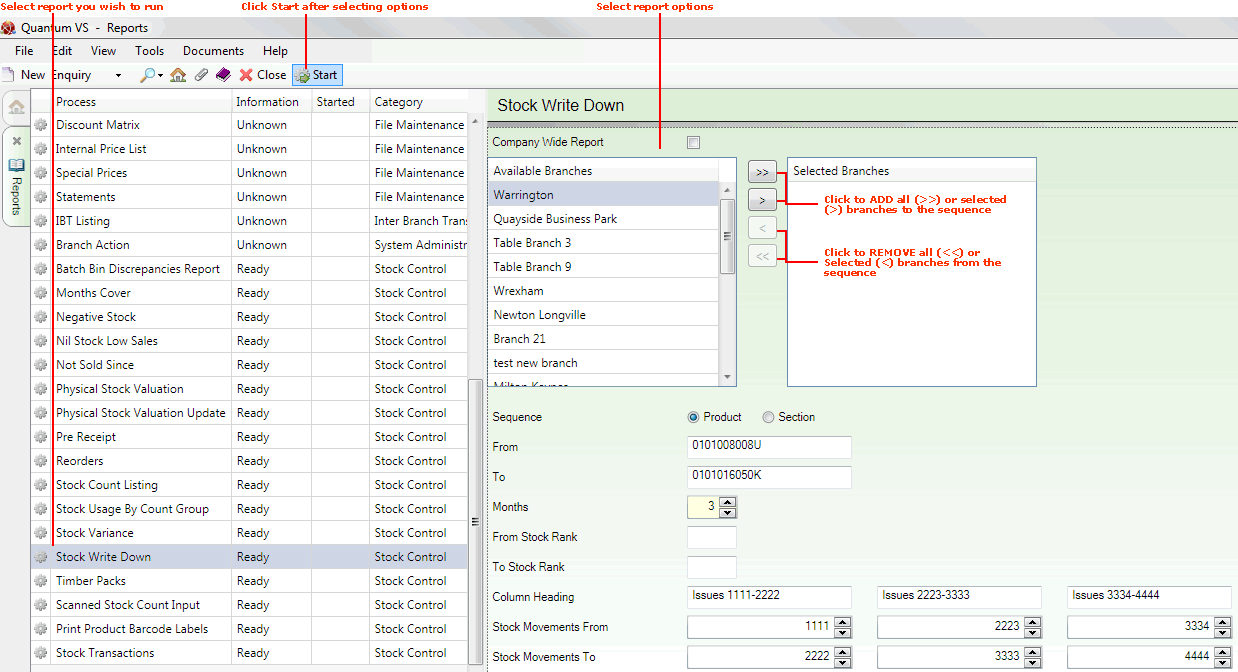
The Stock Write Down report calculates/prints the following for a selected range of products:
the average monthly stock usage (over a selected period of months);
the value of that stock (Average Cost); and
the value of any surplus stock.
In addition, stock movements (issues) are analysed by product group. Users may specify up to three product group ranges and column headings. Total issues (stock movements) for these product group ranges will be shown on the report, effectively allowing you to compare demand by product group.
This report is useful for identifying average stock usage and comparing demand levels and values of current stock.
To run the Stock Write Down report:
1. Either:
Or: From the Toolbar - Main Menu: select Tools > Show Reports.
OR: Click the appropriate module on the Mega Menu then - under reports - select the required Report.
The Reports record opens in a new tab, listing all Reports by Name and Category.
2. Use your mouse or [Tab] key to select the Stock Write Down report:

3. Select report options in the available fields as required, using the following as a guide:
Note: You may use your [Tab] key to move from one field to the next.
|
Field |
Definition (* = mandatory field)
|
|
Company Wide
|
Check this field to run the report on the whole company rather than selected branches (i.e. the report will be based on the Company Wide Stock Record (Branch = 0) rather than all/selected branches).
|
|
Available Branches / Selected Branches
|
If no branches are selected, the report will include ALL branches.
Moving Branches To The Selected Branches List: You may select a specific branch - or branches - to report on by moving branches from the Available Branches list - which lists all of your branches - to the Selected Branches list. Click:
Removing Branches From The Selected Branches List: To remove branches from the Selected Branches list, click:
|
|
Sequence |
Click the appropriate button in order to sequence the report results in Product or Section order.
|
|
From / To
|
If 'Product' was selected above:
In the From and To fields below, enter the first and/or last Product code in the sequence of products you wish to include in the report.
If you enter nothing in the From / To fields, the process will be run on your whole Product list.
If you don't know the Product Code you may enter it automatically using the Finder. To do this:
If 'Section' was selected above:
Note: The section code represents a sequence of up to ten alphanumeric characters or spaces (e.g. PAINT00001). The first five characters represent the Section Name, which is entered on the Section Name field of the Product record (Main tab). The following five characters represent the Section Order Code which is entered on the Section Order Code field of the Product record (Main tab). If either is fewer than five characters in length, enter a space for each missing character. |
|
Months *
|
Enter a number of Months (from 1-12) over which to calculate the average monthly stock usage.
|
|
From / To Stock Rank
|
If you wish to conduct the report on a particular stock rank range, enter the From and To Stock Rank here (i.e. a character from A to Z).
Note: The Stock Rank is used to classify products according to how important it is to keep them in stock. It can be found on the Stock Rank field of the Product record (Stock tab). Products ranked A, B and C are the top three stock rankings in descending order. The 'From' value must be a higher stock rank than the 'To' value. |
|
Column Heading
|
See below. |
|
Stock Movements From / To
|
This section allows the user to display stock movements/issues for up to three product group code ranges, effectively showing 'Total Demand by Product Group' for each defined range.
If required, enter the first and last product group codes in the sequence in the Stock Movements From and To fields as appropriate. You may enter a column header in the Column Heading field above.
Note: A product group code is a number from 1 to 9999. By convention, product group codes are used to partially determine a product's Product Code. Product group codes form the first part of the product code. For example, if a product has the code 0502GRA0005, the '0502' refers to the Product Group. For further details see Defining Product Codes And Descriptions. |
4. Click Start on the Toolbar - Sub Menu to begin running the report.
5. When the report has finished running, a Status message will be shown listing a URL at which the report can be viewed and printed or emailed if necessary.
Note: You may use Print Groups to view, print or email the report at a later date. See Viewing, Printing And Emailing Documents.
Click OK to close this message. You may now close the Reports tab if you wish.
NEXT: Timber Packs Report